
Model Description
This is a simple demonstration to illustrate initial deformation, primary creep and secondary creep of a material subjected to a constant load over time. Students can observe a phenomenon over a few days that often takes years to complete. Students can compute the steady state creep rate and gain an appreciation for the relative time required for primary and secondary creep. This demonstration should take a 20 minutes during a single class, but be monitored and updated over a 3 day period.
Engineering Principle
Creep is defined as the permanent deformation over time of a material subjected to a constant load or stress. For metals, it occurs at higher temperatures, usually greater than 40% of the melting point, and can take years to occur. It is therefore difficult to physically illustrate this concept to students. Fortunately, many polymers experience creep at room temperature and at stresses far below the yield stress of the material. Thus it is possible to create a quick, inexpensive and rudimentary demonstration of creep behavior in the classroom using plastic tubing with a suspended weight. Creep occurs in stages as indicated by the figure below.
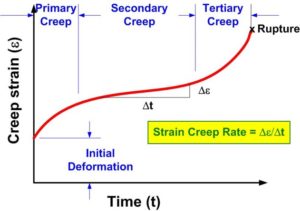
When a load is applied to an object, there is an instantaneous initial deformation that can be computed using basic principals of stress and strain. This first stage of creep is known as primary creep where the slope of the curve is decreasing and the material is experiencing strain hardening. The curve levels off to a constant slope during the secondary stage of creep. This is the longest stage of creep and the material is achieving a balance between strain hardening and recovery of its deformation capability. The slope of the line during this period is the steady state creep rate. The final stage of creep is the tertiary stage and ultimately leads to rupture of the material. The slope of the curve increases as the microstructure of the material changes, cracks form, and the material ruptures.
What You Need
| Item | Quantity | Description/Clarification |
|---|---|---|
| Surgical Tubing | 3 to 8 feet | Any small diameter piece of tubing will work. You will want a piece that is long enough for the students to observe the deformations yet short enough to fit in your classroom. Longer pieces of tubing will produce larger deformations. |
| Weight | 1 | The weight should be large enough to cause a substantial initial deformation, roughly 20-40% rupture strain. (20-40% of rupture strain if using tubing. If using another material, 20-50% of ey might be appropriate). If the weight is too small, the creep curve will take a long time to develop. If it is too big, the creep will either be unrealistically accelerated or produce an early rupture. |
| Hook | 1 | Attach the hook to either the ceiling or an upper portion of the wall. |
| Yardstick | 1 | Attach the yardstick to the wall, next to the hanging weight. Use either a screw or tape. If tape is used, provide a sufficient quantity that a minor disturbance will not cause the yardstick to move |
How It’s Done
Before Class: Mount a hook in the classroom from which to hang a weight suspended from a long piece of surgical tubing. Affix the yardstick to the wall next to where the weight will hang. Tie the surgical tubing to the weight, but do not hang it yet. This should take 10-15 minutes.
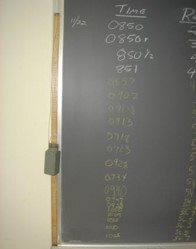
In Class: Attach the surgical tubing to the hook and mark the location of the weight in the undeformed position on the yardstick. You will have to suspend the weight in your hand to make this mark. Gently release the weight, allow the surgical tubing to deform and record the difference between the initial mark and its current location on the yardstick. Record the data on the blackboard. Have a student take a reading every minute for the first five minutes. Record the time and the reading on the yardstick on the blackboard. Continue taking readings every five minutes for the remainder of the class period.
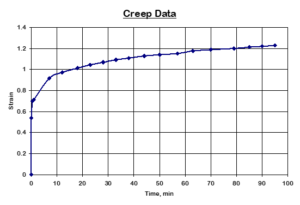
Prepare a spreadsheet in advance and enter the data into the spreadsheet. Divide the deformation by the initial length of the surgical tubing to obtain the strain. Convert the recorded clock times to a standard unit of time such as hours or minutes. At the end of the class period, an initial creep curve can be posted on the board. Data from an actual class experiment after 100 minutes is shown below.
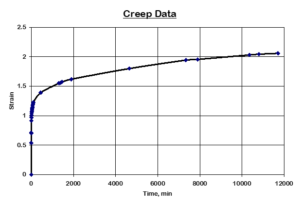
Continue taking readings over several days at convenient times. They do not have to be taken often. At the beginning of class, show the updated creep curve. For the experiment shown below, the data was collected over nine days.
It may not be productive to continue the experiment any longer. The learning points have been made and it is unlikely that anyone will be around to capture the data for tertiary creep. It will happen quickly and may occur during the middle of the night. You will probably have moved on to another topic, so quit while you are ahead, unless the students are interested enough to continue the experiment to rupture.
Additional Application: Incorporate the data generated into a homework problem. Have the students estimate the steady-state creep rate and use it to solve a problem. Ask the students to identify the regions of primary creep and secondary creep. Have them comment on the amount of time the tubing spent in each stage. When determining creep life, is it reasonable to neglect primary creep? Discuss the difference in short-life creep applications where the time to rupture is the most relevant engineering parameter and long-life creep applications where the steady-state creep rate is the more applicable. Discuss how actual creep rupture tests are conducted in the laboratory and compare it to the simple experiment just conducted.